Prometheus 指标监控
Prometheus 是由 SoundCloud 开源的监控告警解决方案[3],它可以被用于程序暴露一系列监控指标给外界,用于对程序的性能、运行状态进行监控,并且还提供了监控告警功能。
基本架构
以下是官方给出的架构图
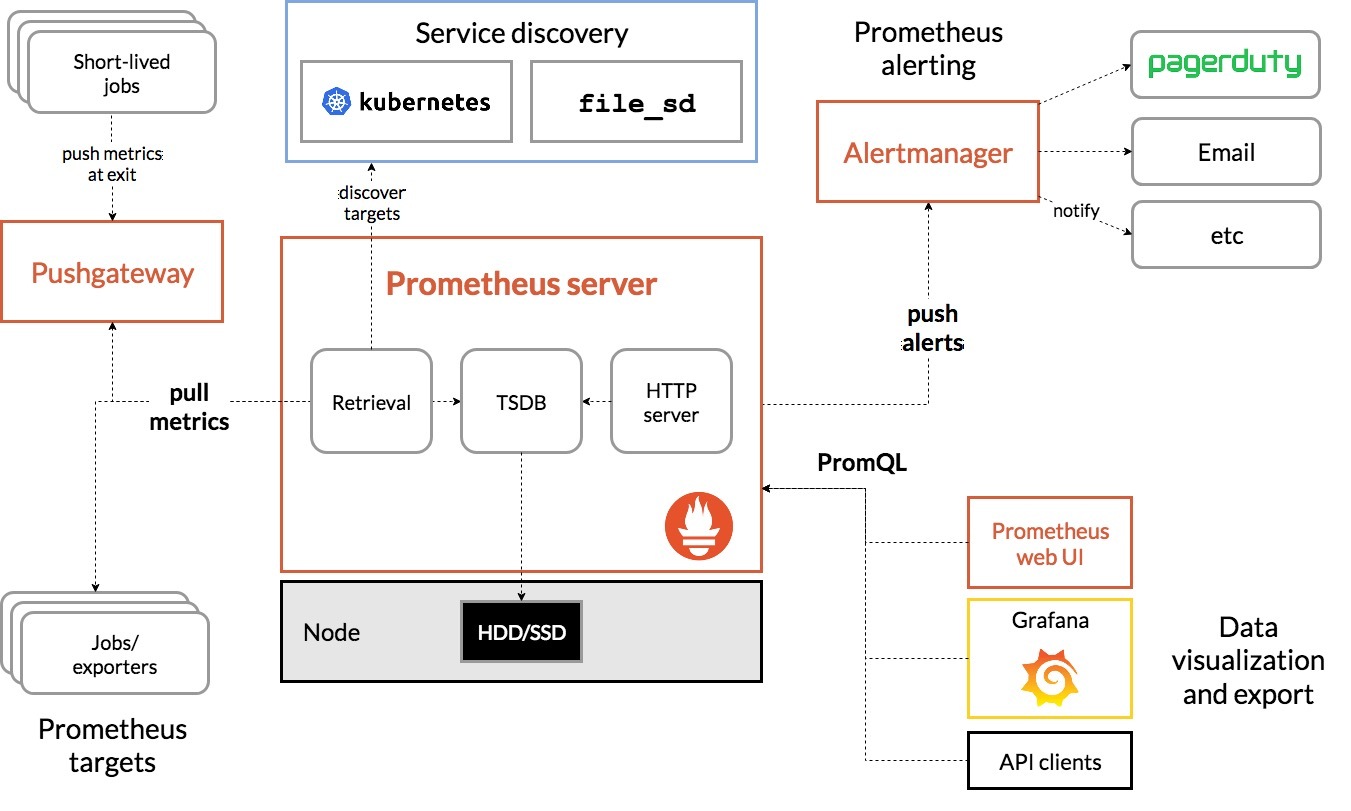
在图中,Prometheus 的组成部分有[3]:
- Prometheus Server:抓取和存储时间序列化数据
- Exporters:主动拉取数据的插件
- Pushgateway:被动拉取数据的插件
- Altermanager:告警信息发送模块
- Prometheus web UI:界面化,包含结合 Grafana 进行数据展示或告警发送
其工作逻辑如下[4]:
- Prometheus server 定期从静态配置的目标(target)或服务发现的目标中拉取指标(metric)数据;
- 拉取数据大于内存缓冲区大小时,将数据持久化到数据库(时序数据库);
- Prometheus 可以配置规则,用于定时查询数据,在条件触发时将警告推送到配置的 Altermanager;
- Altermanager 受到告警时,可以根据配置,聚合、去重、降噪,最后发送警告;
- 可以使用 API、Prometheus Console 或者 Grafana 查询和聚合数据;
四大指标类型
这里主要是 Golang 下的 Prometheus 指标,需要其它语言可以根据需求查找[1]
Prometheus 定义了四种不同的指标类型[2]:Counter(计数器)、Gauge(仪表盘)、Histogram(直方图)、Summary(摘要)
Counter:只增不减的计数器
Counter Metrics 是只能递增的值,可以一用来记录 API 的请求次数、错误码的触发次数,它的接口如下
1
2
3
4
5
6
7
8
9
10
11
type Counter interface {
Metric
Collector
// Inc increments the counter by 1. Use Add to increment it by arbitrary non-negative values.
// Inc 方法会为计数器 +1
Inc()
// Add adds the given value to the counter. It panics if the value is < 0.
// 传入一个 value 为计数器添加对应的值,如果小于 0 会报 painc
Add(float64)
}Gauge:可增可减的仪表盘
Gauge Metrics 侧重于反应系统当前的状态,这样的数据可增可减,也可以直接设置,常用于显示当前主机的空闲内容大小、可用的内存大小,其接口如下
1
2
3
4
5
6
7
8
9
10
11
12
13
14
15
16
17
18
19
20
21
22
23
type Gauge interface {
Metric
Collector
// Set sets the Gauge to an arbitrary value.
// 为该指标设置一个值
Set(float64)
// Inc increments the Gauge by 1. Use Add to increment it by arbitrary values.
// 为该指标增加 1
Inc()
// Dec decrements the Gauge by 1. Use Sub to decrement it by arbitrary values.
// 为该指标减少 1
Dec()
// 为指标增加一个指定值
// Add adds the given value to the Gauge. (The value can be negative, resulting in a decrease of the Gauge.)
Add(float64)
// 为减去一个指定值
// Sub subtracts the given value from the Gauge. (The value can be negative, resulting in an increase of the Gauge.)
Sub(float64)
// SetToCurrentTime sets the Gauge to the current Unix time in seconds.
SetToCurrentTime()
}Histograms:指定范围的直方图
Histograms 是直方图度量类型,测量落在定义的桶中的数据的数据的值,可以用于记录 API 服务的请求耗时在所有桶中的分布情况、或者消费者处理某个事件的好事在所有桶中的分布情况,其接口也比较简单
1
2
3
4
5
6
7
8
9
10
11
12
13
14
15
type Histogram interface {
Metric
Collector
// Observe adds a single observation to the histogram. Observations are
// usually positive or zero. Negative observations are accepted but
// prevent current versions of Prometheus from properly detecting
// counter resets in the sum of observations. (The experimental Native
// Histograms handle negative observations properly.) See
// https://prometheus.io/docs/practices/histograms/#count-and-sum-of-observations
// for details.
// 传入一个观察值,这个值通常是大于等于 0 的数,负的值也可以接受
// 但是导致检测观测值总和中的计时器不能正常重置
Observe(float64)
}Summary:分位数下的直方图
Summary 和 Histograms 一样是统计直方图数据,但是也存在不一样的地方:
Summary 基于分位数来统计数据,而 Histogram 基于桶来统计数据
Histogram 的分位数在 Prometheus 上计算,而 Summary 则是在提供度量数据的应用上来计算,此后再暴露数据到接口外
Summary 用于需要计算准确的分位数,但是并不能知道值的精确范围
它的接口和 Histogram 类似
1
2
3
4
5
6
7
8
9
10
11
12
type Summary interface {
Metric
Collector
// Observe adds a single observation to the summary. Observations are
// usually positive or zero. Negative observations are accepted but
// prevent current versions of Prometheus from properly detecting
// counter resets in the sum of observations. See
// https://prometheus.io/docs/practices/histograms/#count-and-sum-of-observations
// for details.
Observe(float64)
}
实时指标监控
使用 Prometheus 对程序进行监控并且实时观察指标有三个步骤:
- 在程序中编写指标监控代码,并且暴露一个http服务便于外界拉取数据;
- 安装 Prometheus 服务端,在配置文件下指定需要监控的 http 链接并启动;
- 进一步地,如果需要对多个指标同时进行实时的查看,可以安装 Grafana 进行数据的实时监控;
指标服务及代码
要对外界暴露指标的服务接口,需要指定端口并启动服务,在 golang 中暴露 mertics 服务的代码如下
1 | // 从配置文件中获取端口 |
此外,还需要注册指标并且对指标进行操作,例如,使用仪表盘来监控一个节点下的交易数量,需要注册一个仪表盘指标
1 | var ( |
在接收交易时,可以通过调用 Inc 方法来对指标 +1
1 | poolTransactionsMetric.Inc() |
类似地,可以调用 Dec 方法在打包交易时对指标 -1
假设暴露的端口是 9090,在完成这些工作后可以访问 http://localhost:8700/metrics 得到指标数据,这些指标表现为键值对的形式
而 Prometheus 的服务端就是根据配置文件,每隔一段时间访问 targets 来获取指标数据并进行解析,并且放入内存、数据库
Prometheus 安装以及配置
Prometheus 本身是一个开源项目,所以可以直接安装程序并启动,例如目前最新的已编译好的安装包在 Prometheus 2.46.0
此外,也有 windows 下的安装教程 Windows 安装 prometheus + grafana
以及在安装后需要修改配置文件 prometheus.yml,一个简单的配置文件如下:
1 | global: |
如果配置文件中没有设置端口,默认会使用 9090 端口来暴露 Prometheus 的数据查询服务
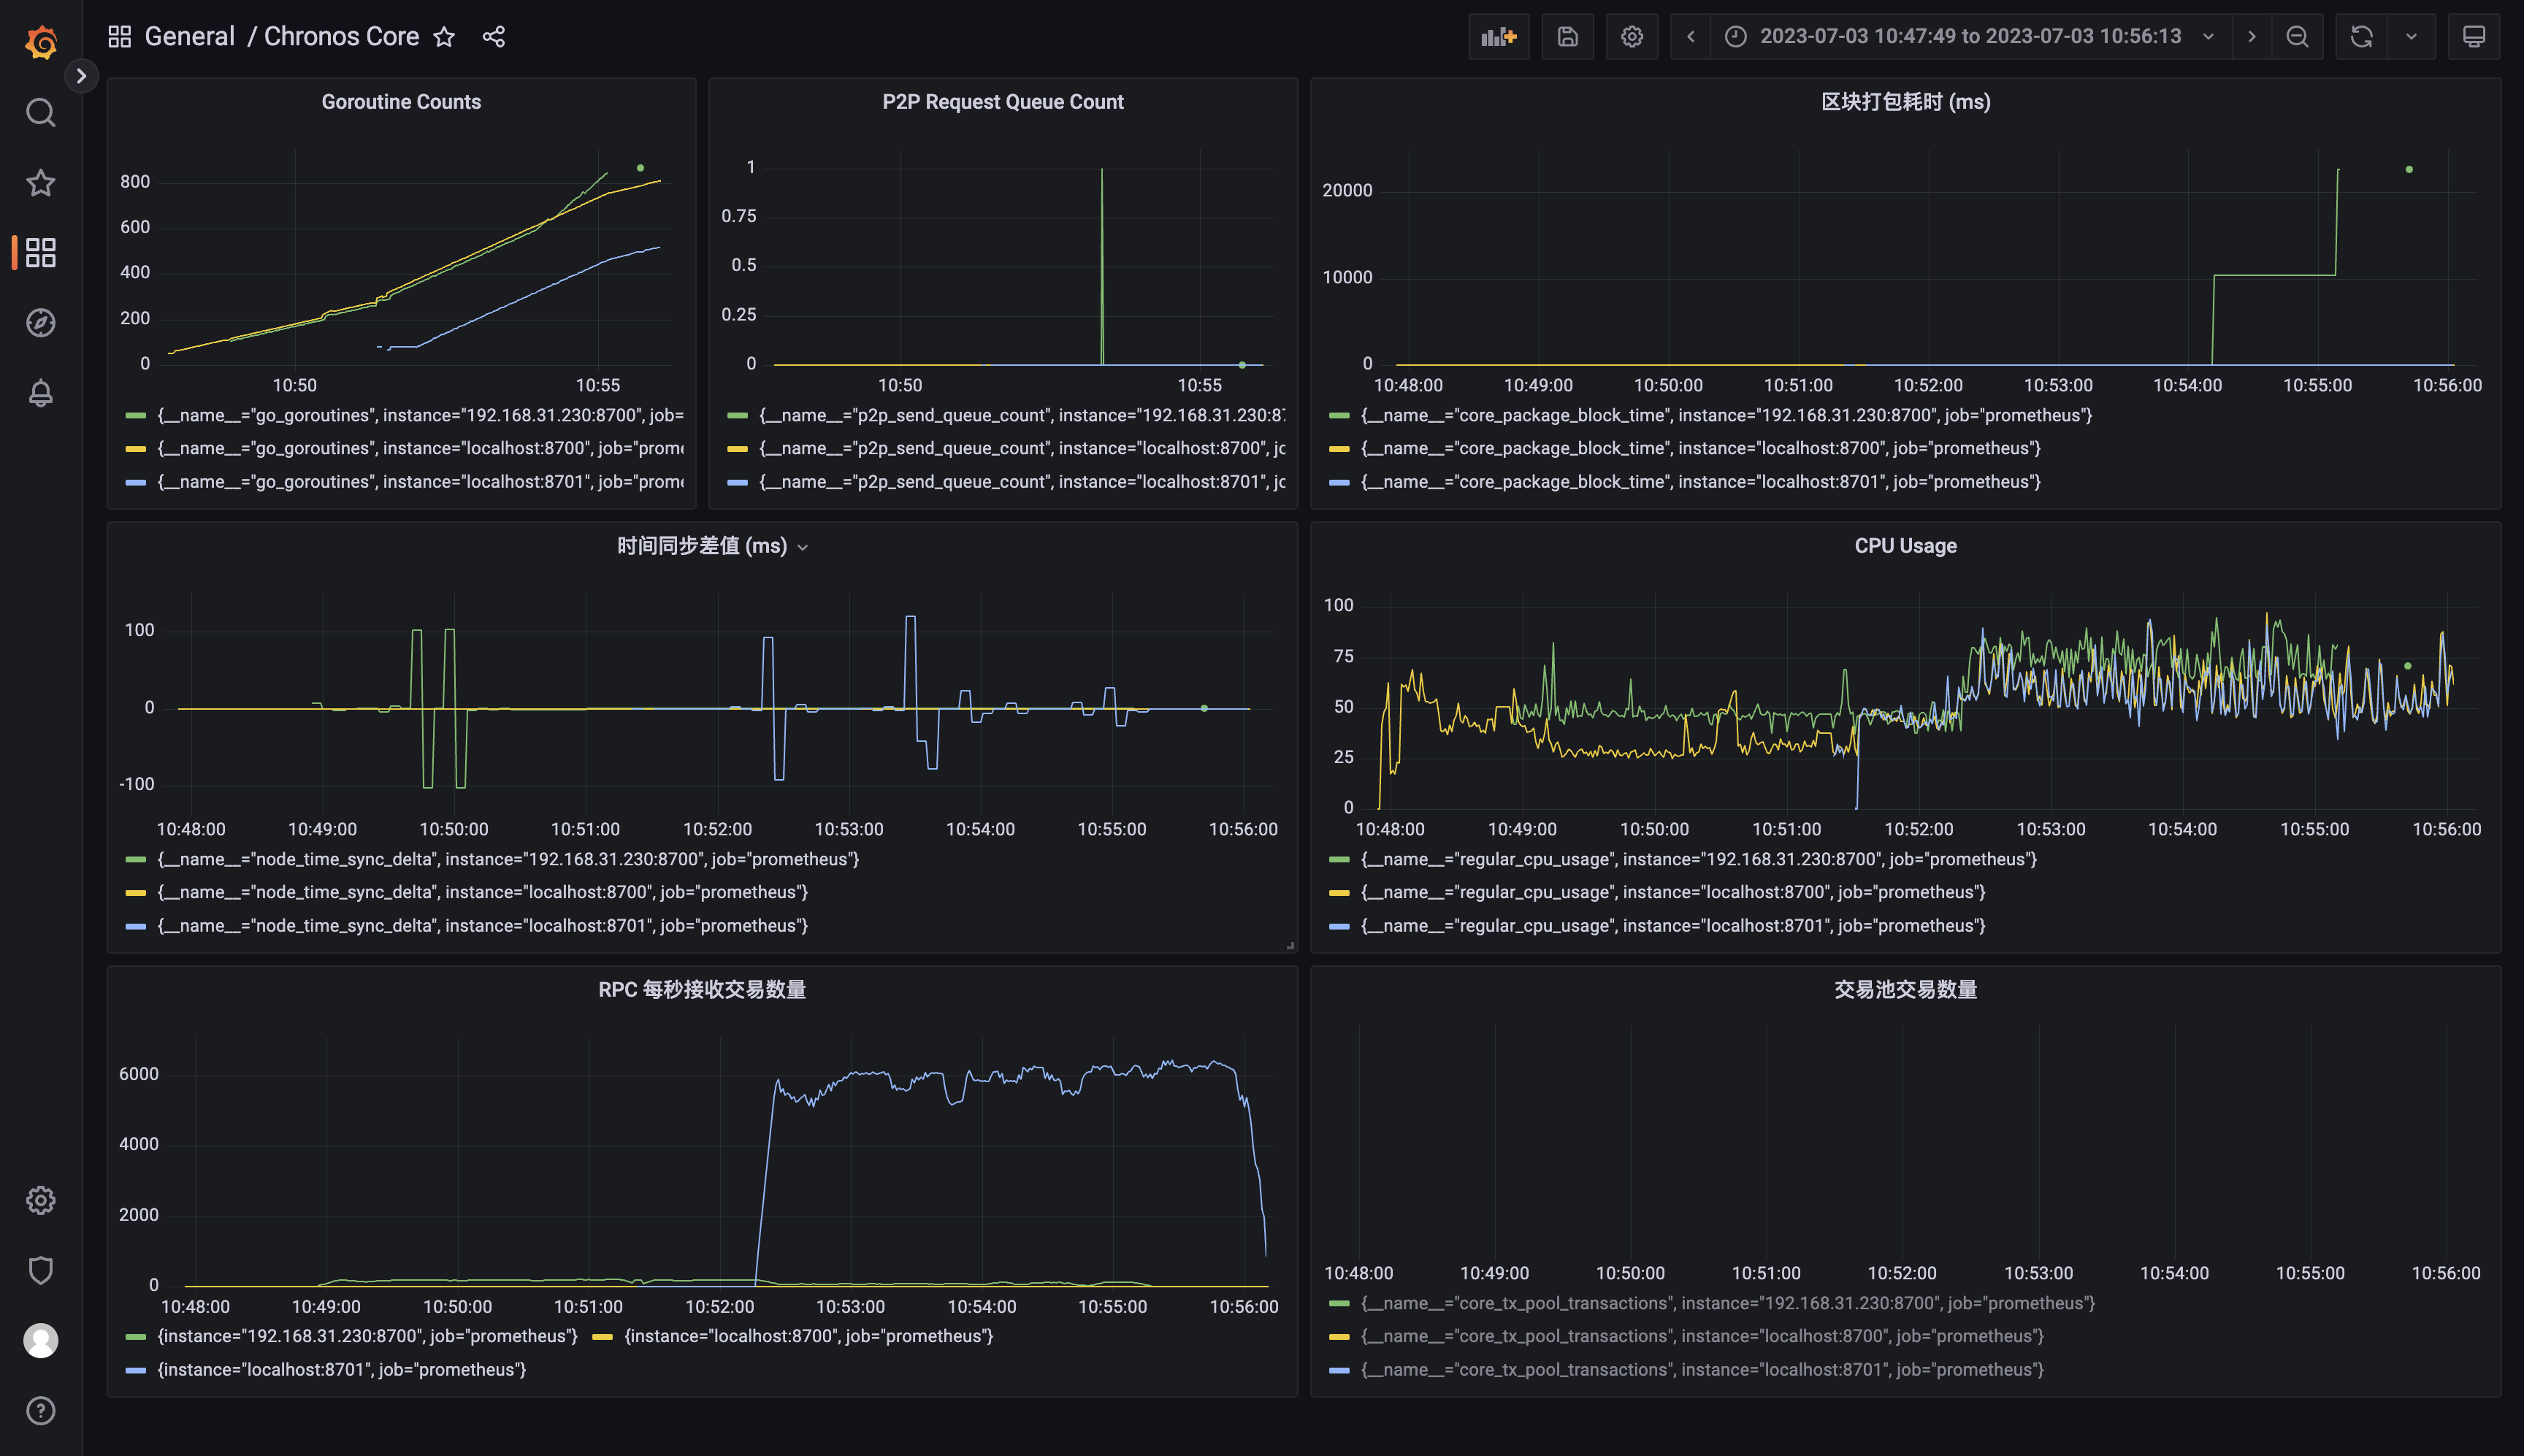
最后,Grafana 的安装和使用不再进行赘述,Grafana 类似一个数据库查询展示工具,它通过拉取 Prometheus 暴露的数据查询服务来得到信息并在前端进行展示,例如对节点的一系列指标监控如下